
tl;dr: skip to implementation
When I moved house recently I took the opportunity to move ISP and get FTTP installed. I’d heard good things about Andrews & Arnold and the idea of an ISP who treated their customers as knowledgable was definitely appealing.
My previous ISP didn’t impose a quota (or may have done a “fair-use” arrangement, which I never found the edges of). A&A offer two quota levels, 1TB a month or 10TB a month. 1TB seemed about right (based on eyeballing the stats on my router), and while 10TB was only £10/month extra, it didn’t seem like I needed to pay the extra expense for that - especially while covering house-moving costs. I wasn’t worried about locking myself in to something as 50% of your unused quota rolls over to the next month, you can top-up as you go, and finally you can change quota for no (admin) charge.
That said, I wanted to keep an eye on my quota usage so went looking for ways to monitor it. There’s information about your quota usage on the “Control” page for your connection, and I had a bit of a poke at an API they seemed to offer but couldn’t make it go properly - the documentation I found didn’t feel very current and I couldn’t get it to authenticate properly anyway.
Then I noticed that the A&A homepage was showing me my quota as a little overlay on the homepage. This meant two things: first, it was “unauthenticated”, in the sense that I didn’t need to log in - it must be done by my source IP; and second, I might be able to fetch it programmatically to get the data.

A quick poke at it in the developer tools in my browser showed it was an
<img> tag loading https://quota.aa.net.uk (sadly without any alt text or
other accessibility info I could parse out, so scratch that approach).
However, poking at that URL showed it was serving an SVG, which if all else failed would be trivially parsable:
% http -F --print Hb https://quota.aa.net.uk
GET / HTTP/1.1
Accept: */*
Accept-Encoding: gzip, deflate, br
Connection: keep-alive
Host: quota.aa.net.uk
User-Agent: xh/0.18.0

<?xml version="1.0" encoding="UTF-8" standalone="no"?>
<svg xmlns="http://www.w3.org/2000/svg" width="140" height="50">
  <rect width="100" height="40" x="4.247" y="4.526" rx="0" ry="0"
    fill-opacity=".75" fill="green"/>
  <text x="52" y="37" font-size="18" font-family="Arial" text-anchor="middle"
    fill="#E9E9E9">
    734 GB
  </text>
  <text x="52" y="16" font-size="11" font-family="Arial" text-anchor="middle"
    fill="#E9E9E9">
    Remaining quota:
  </text>
</svg>
(Note: quota.aa.net.uk generates a redirect initially, which is why I need -F
on that command. Since their canonical use is against that name I’ll use it too,
since it allows them to change their implementation without breaking mine :)
Having it in something like JSON would be nicer though, and there’s already a
way to request a particular format in HTTP with the Accept header.
Fortunately, it works!
% http -F --print Hb https://quota.aa.net.uk Accept:application/json
GET / HTTP/1.1
Accept: application/json
Accept-Encoding: gzip, deflate, br
Connection: keep-alive
Host: quota.aa.net.uk
User-Agent: xh/0.18.0

{
    "monthly_quota": 1000000000000,
    "monthly_quota_gb": 1000,
    "quota_remaining": 734989049959,
    "quota_remaining_gb": 734,
    "quota_status": "green"
}
This is why you use ISPs like this :)
The next step was to get the data in to Home Assistant. Home Assistant is
written in Python which I’m extremely happy hacking around in, so I did wonder
about writing it as a HASS Integration. However, there’s already a REST
integration which can fetch
and parse data from simple endpoints like this to expose it as sensors, so I
went with that route.
Fetching the data with HASS
Note: I’m not sure I’m doing this the right/most elegant way - if you know better, please let me know! Also, I’m writing this a couple of months after hacking it together, so hopefully I have remembered all the right bits to set up.
If you haven’t done so already, you’ll need to add the “Terminal & SSH” Add-on to your HomeAssistant install (or have terminal/SSH access to your config another way). It’s in Settings → Add-ons, or hopefully this button works:

You can then jump in to the Terminal (on the left-hand menu) or SSH, and cd
config to your configuration directory.
Edit configuration.yaml with your preferred editor and add, if needed:
sensor: !include sensors.yaml
Save the file, and create/edit sensors.yaml. In it, add this block:
- platform: rest
  resource: https://quota.aa.net.uk
  headers:
    Accept: application/json
  name: ISP Quota
  json_attributes:
    - monthly_quota
    - monthly_quota_gb
    - quota_status
  unique_id: aa_quota_gb
  value_template: '{{ int(value_json.quota_remaining_gb) }}'
  device_class: data_size
  unit_of_measurement: GB
  scan_interval: 1800
This will create a sensor with your remaining quota in GB, with attributes for
the monthly quota, monthly quota in GB, and “status” - haven’t seen what other
values this can hold than green but I assume red is likely to be one ;)
You can modify the name and unique_id as you wish, and if you want the
sensor to be for the value in bytes not GB, change the property in
value_template (and the unit_of_measurement). If you change these, you’ll
want to use your values in the sections below.
The data from the API seems to update once an hour, so I’ve set the refresh interval for HASS to 30 minutes to make sure I’m not too far behind but not hammering the API.
Save the file and have Home Assistant reload its configuration.
You should now have a sensor.aa_quota_gb entity in HASS which you can find in
the Developer Tools → States page, or tap e to bring up the quick
search panel. You can use this sensor for a dashboard widget to see your quota
progress.

And of course you’ll get a nice graph for it once you have some historical data:

Calculating more information
What I wanted though was to be able to see how I was doing with my monthly usage compared to “ideal” (that is, monthly quota ÷ days in month).
This can be done with templates, which let us do some calculations.
Return to the terminal, and make sure this line is in configuration.yaml:
template: !include templates.yaml
Now create/edit templates.yaml and add the following:
- name: Quota target
  unique_id: sensor.quota_target
  state: >
    {{
      state_attr('sensor.aa_quota_gb', 'monthly_quota_gb')
      - (state_attr('sensor.aa_quota_gb', 'monthly_quota_gb')
      / ((now().replace(day=1) + timedelta(days=32)).replace(day=1) - timedelta(days=1)).day) * now.day()
    }}
  unit_of_measurement: GB

- name: Quota gap
  unique_id: sensor.quota_gap
  state: >
    {{
      states('sensor.aa_quota_gb') | int
      - states('sensor.quota_target') | int
    }}
  unit_of_measurement: GB
These give you a sensor which tells you your “target” - how much data you’d have left if you were using it at the rate to have none left at the end of the month, and the “gap” - how much ahead or behind of this value you are. The rather long datetime invocation at the end of the first one is to get the number of days in the current month.
Save the file and reload your configuration, and you should now have these sensors showing up.
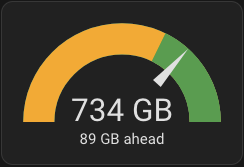
For my dashboard widget, I wanted to use the Gauge card, with the currently monthly quota as the maximum, my remaining quota as the needle value, and then change the background colour based on the target. It turns out the standard widget stuff can’t quite be this dynamic, but fortunately there’s a custom card you can install which supports templating for cards.
You’ll need to have HACS installed, and then you can install this custom card via that. I’ll not reproduce the two sets of instructions for those here; if you need to do it follow their documentation.
Once you have it installed, you can create a dashboard widget with this YAML:
type: custom:config-template-card
entities:
  - sensor.aa_quota_gb
  - sensor.quota_target
variables:
  TARGET: states['sensor.quota_target'].state
  MAX: states['sensor.aa_quota_gb'].attributes.monthly_quota_gb
  GAP: |
    () => {
      return states['sensor.quota_gap'].state + " GB" +
        (parseInt(states['sensor.quota_gap'].state) >= 0 ? " ahead" : " behind")
    }
card:
  type: gauge
  entity: sensor.aa_quota_gb
  min: 0
  needle: true
  max: ${MAX}
  severity:
    green: ${TARGET}
    yellow: -1
  name: ${GAP()}
This also sets the “name” of the gauge (the text below the value) to be the
number of GB ahead or behind the quota I am, using the quota_gap sensor.
Negative values mean I’m behind, and need to slow down to avoid running out of
quota early!